
The Mechanics of
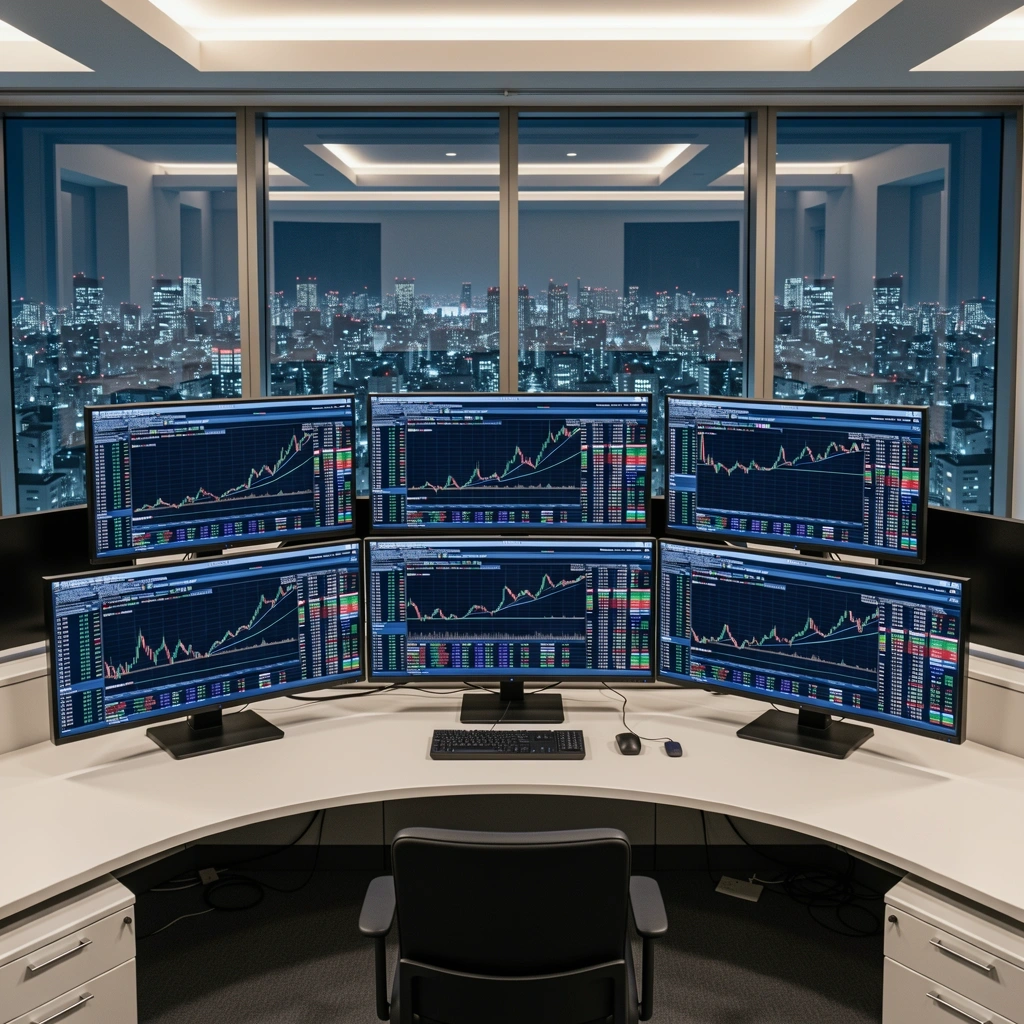
In our Osaka facility, we treat binary trading as a high-frequency data problem. This laboratory environment is dedicated to the breakdown of signal generation, stripping away the noise of the market to reveal the underlying mathematical probabilities of short-term price movement.
Anatomy of an Entry Point
We do not provide live alerts. Instead, we archive specific signal events to study why they succeeded or failed. Below is a static breakdown of a typical 5-minute contract signal generated by our proprietary volatility-reversion model.
Variable Inputs
- Indicator A (RSI-14): 74.5
- Indicator B (Bollinger): Upper Break
- Stochastics (5,3,3): 82/80 Cross
- Volume Delta: +12% over avg
Technical Indicator Logic
This signal occurred following a parabolic move in the USD/JPY pair. Our analytics detected a divergence between the exponential moving average (EMA 20) and the price action, suggesting a liquidity gap. The binary trading logic here prioritizes a "reversion to mean" strategy, anticipating a bearish correction within a 300-second timeframe.
Reliability
68.4%
Avg Drawdown
1.2 Pips
Timeframe
M5
Market State
Trend
Reference Indicator Deck
Binary contracts require speed and precision. Unlike traditional equities, a "win" is binary—even a fraction of a pip determines the outcome. We focus on four core categories of technical indicators that provide the highest sensitivity to short-term shifts.
Momentum Oscillators
RSI and Stochastic indicators are calibrated for identification of overbought or oversold exhaustion points. In our lab, we look for 'extreme-state' triggers where price momentum deviates significantly from the 5-period average.
Volatility Envelopes
Bollinger Bands and Keltner Channels serve as our primary boundaries. 95% of price action typically occurs within these bands; binary signals are often most potent when price breaches the 2nd standard deviation and begins its return journey.
Volume Profile Analysis
Price movement without volume support is a trap. Our signals are cross-referenced with Tick Volume to ensure that a price break has sufficient liquidity behind it to sustain the movement for the duration of the contract.

"The difference between a signal and gambling is the validation process. Every technical indicator in our lab undergoes a 12-month backtesting cycle against historical Osaka Exchange data before being considered for our static signal examples."
— Senior Analyst, Osaka Binary Labs
Signal Verification Workflow
Origin Detection
Raw market data is ingested from various liquidity providers. Preliminary signals are flagged by the base algorithm.
Conflict Check
Cross-referencing signals against global economic calendars to filter out artificial spikes from high-impact news.
Probability Scoring
Signals are assigned a percentage score based on historic performance of similar market conditions.
Archive Processing
The finalized data point is logged in our Signal Lab for retrospective research and educational review.
Deepen Your Analysis
Understanding the 'how' behind a signal is the first step toward disciplined binary trading. Explore our full methodology or reach out for technical inquiries regarding our research standards.
Location
Osaka Exchange 3, Japan
Support Hours
Mon-Fri: 9:00-18:00
Direct Inquiry
+81 6 5555 7777